Monitor Claude Code Usage With Grafana
As part of a longer post on how we can use OpenTelemetry to observe AI agent behaviours, I started capturing OTEL tracing from Claude Code. It may not be common knowledge but Claude supports this out of the box. All you need is a place to send the data (I use Grafana cloud) and then to set some environment variables.
In a time where Anthropic is changing limits ad-hoc, users are claiming to use up half their usage a couple of simple prompts and Anthropic provides no easy way to quantify usage, OpenTelemetry and a little Grafana/visualisation magic is our friend.
Get a place to ship the data to
OpenTelemetry is a standardised framework, adopted by plenty of observability tooling. If you have something you already use, just use that.
Grafana Cloud
If you want to be fast with minimal effort, give Grafana Cloud a try. They have a generous free tier and Grafana is the GOAT for observability.
Grafana Cloud credentials
Grafana Cloud needs some extra information, the endpoint and authentication details (your account ID and API Key). Unfortunately they don’t make this super easy to find…
Account ID, API-Key and OpenTelemetry / OTLP endpoint
- You can see all your “Stacks” (Grafana, Loki, Prometheus etc.) at https://grafana.com/profile/org;
- Click “Details” on your stack (in my case “braw”);
- Find the OpenTelemetry card and press “Configure” (screenshot below);
- Note your OTLP Endpoint, Instance ID;
- Create an API Token and note that as well;


Local SigNoz
Want to run it locally? You can also use Open Source Grafana however I prefer SigNoz in a container as it’s so quick and easy to get up and running.
The choice is yours.
Start a local collector
As I’m using Grafana Cloud I’m also going to use Grafana Alloy to collect and ship my OTEL data. Despite being a Grafana product it does also support collecting OpenTelemetry data.
An OpenTelemetry collector is a “vendor-agnostic way to receive, process and export telemetry data.”
In our case, Alloy is a lightweight application we’re going to use to collect our metrics, logs and traces data, possibly perform some processing and then ship it to destinations of choice.
I like to do this so I can configure my OTEL applications to send data to Alloy and then Alloy is configured to send to both Grafana Cloud and my local SigNoz instance. This way I have a couple of copies of the data and can equally compare tools.
You will likely only want to send the data to Grafana Cloud.
We’ll write an Alloy config file using the token from earlier to
push to our Grafana stack.
This creates an OLTP endpoint listening on :4317 and :4318, batches the requests and sends them
to our Grafana Cloud stack.
otelcol.auth.basic "default" {
  username = "<ACCOUNT ID>"
  password = "<API TOKEN>"
}

otelcol.exporter.otlphttp "default" {
  client {
    endpoint = "<OTLP_ENDPOINT>"
    auth     = otelcol.auth.basic.default.handler
  }
}

otelcol.receiver.otlp "default" {
  grpc {
    endpoint = "127.0.0.1:4317"
  }

  http {
    endpoint = "127.0.0.1:4318"
  }

  output {
    metrics = [otelcol.processor.batch.default.input]
    logs    = [otelcol.processor.batch.default.input]
    traces  = [otelcol.processor.batch.default.input]
  }
}

otelcol.processor.batch "default" {
  output {
    metrics = [otelcol.exporter.otlphttp.default.input]
    logs    = [otelcol.exporter.otlphttp.default.input]
    traces  = [otelcol.exporter.otlphttp.default.input]
  }
}
Then I’m going to spin up a container with Podman (but you can also replace it with docker):
podman run \
    -v <CONFIG_FILE_PATH>:/etc/alloy/config.alloy \
    -p 12345:12345 \
    -p 4317:4317 \
    -p 4318:4318 \
    grafana/alloy:latest \
    run --server.http.listen-addr=0.0.0.0:12345 --storage.path=/var/lib/alloy/data \
    /etc/alloy/config.alloy
(replace <CONFIG_FILE_PATH> with where you stored the file before, e.g. ./otel-config.alloy)
and check that it runs on http://localhost:12345/.
Tell Claude Code to use OpenTelemetry
Once you have your OTEL stack ready, we need to tell Claude to push data there. For that there are
some basic environment variables we need to configure and some optional ones to capture more info (a
full list of possible related variables and some notes on them can be found in --verbose mode).
We’re going to make use of the standard OTEL logs and enable a beta OTEL tracing feature. Unfortunately the tracing doesn’t seem to properly attach spans to a trace as it should but we still get some data showing.
# Undocumented Beta tracing
export BETA_TRACING_ENDPOINT="http://localhost:4318"
export CLAUDE_CODE_ENHANCED_TELEMETRY_BETA=1
export ENABLE_BETA_TRACING_DETAILED=1

# Base telemetry config
export CLAUDE_CODE_ENABLE_TELEMETRY=1
export CLAUDE_CODE_OTEL_FLUSH_TIMEOUT_MS=1000
export OTEL_EXPORTER_OTLP_ENDPOINT="http://localhost:4317"
export OTEL_EXPORTER_OTLP_PROTOCOL="grpc"

# Lower the export interval so we see results faster
export OTEL_LOGS_EXPORT_INTERVAL=1000
export OTEL_METRIC_EXPORT_INTERVAL=1000

# Make sure we tell the exporters to use OTLP
export OTEL_LOGS_EXPORTER="otlp"
export OTEL_METRICS_EXPORTER="otlp"
export OTEL_TRACES_EXPORTER="otlp"
additionally, if you want to also log tool content, details and user prompts add the following exports:
export OTEL_LOG_TOOL_CONTENT=1
export OTEL_LOG_TOOL_DETAILS=1
export OTEL_LOG_USER_PROMPTS=1
then we run claude code as normal:
claudeFull list of OTEL environment variables supported by Claude at the time of writing:
| Environment variable | Note |
|---|---|
CLAUDE_CODE_ENABLE_TELEMETRY | Required to ship OTEL data |
CLAUDE_CODE_ENHANCED_TELEMETRY_BETA | Still investigating what this does |
CLAUDE_CODE_OTEL_FLUSH_TIMEOUT_MS | |
CLAUDE_CODE_OTEL_HEADERS_HELPER_DEBOUNCE_MS | |
CLAUDE_CODE_OTEL_SHUTDOWN_TIMEOUT_MS | |
CLAUDE_CODE_PERFETTO_TRACE | Seems to need a feature flag but could be used to profile claude |
OTEL_EXPORTER_OTLP_ENDPOINT | |
OTEL_EXPORTER_OTLP_HEADERS | |
OTEL_EXPORTER_OTLP_INSECURE | |
OTEL_EXPORTER_OTLP_LOGS_PROTOCOL | |
OTEL_EXPORTER_OTLP_METRICS_PROTOCOL | |
OTEL_EXPORTER_OTLP_METRICS_TEMPORALITY_PREFERENCE | |
OTEL_EXPORTER_OTLP_PROTOCOL | |
OTEL_EXPORTER_OTLP_TRACES_PROTOCOL | |
OTEL_EXPORTER_PROMETHEUS_HOST | |
OTEL_EXPORTER_PROMETHEUS_PORT | |
OTEL_LOG_TOOL_CONTENT | |
OTEL_LOG_TOOL_DETAILS | |
OTEL_LOG_USER_PROMPTS | |
OTEL_LOGS_EXPORT_INTERVAL | |
OTEL_LOGS_EXPORTER | |
OTEL_METRIC_EXPORT_INTERVAL | |
OTEL_METRICS_EXPORTER | |
OTEL_TRACES_EXPORT_INTERVAL | |
OTEL_TRACES_EXPORTER |
Visualise your usage
Once you’ve sent a few prompts you should expect to see data in your observability tool. As a Grafana Cloud user, this is an example of what I have chosen to see:
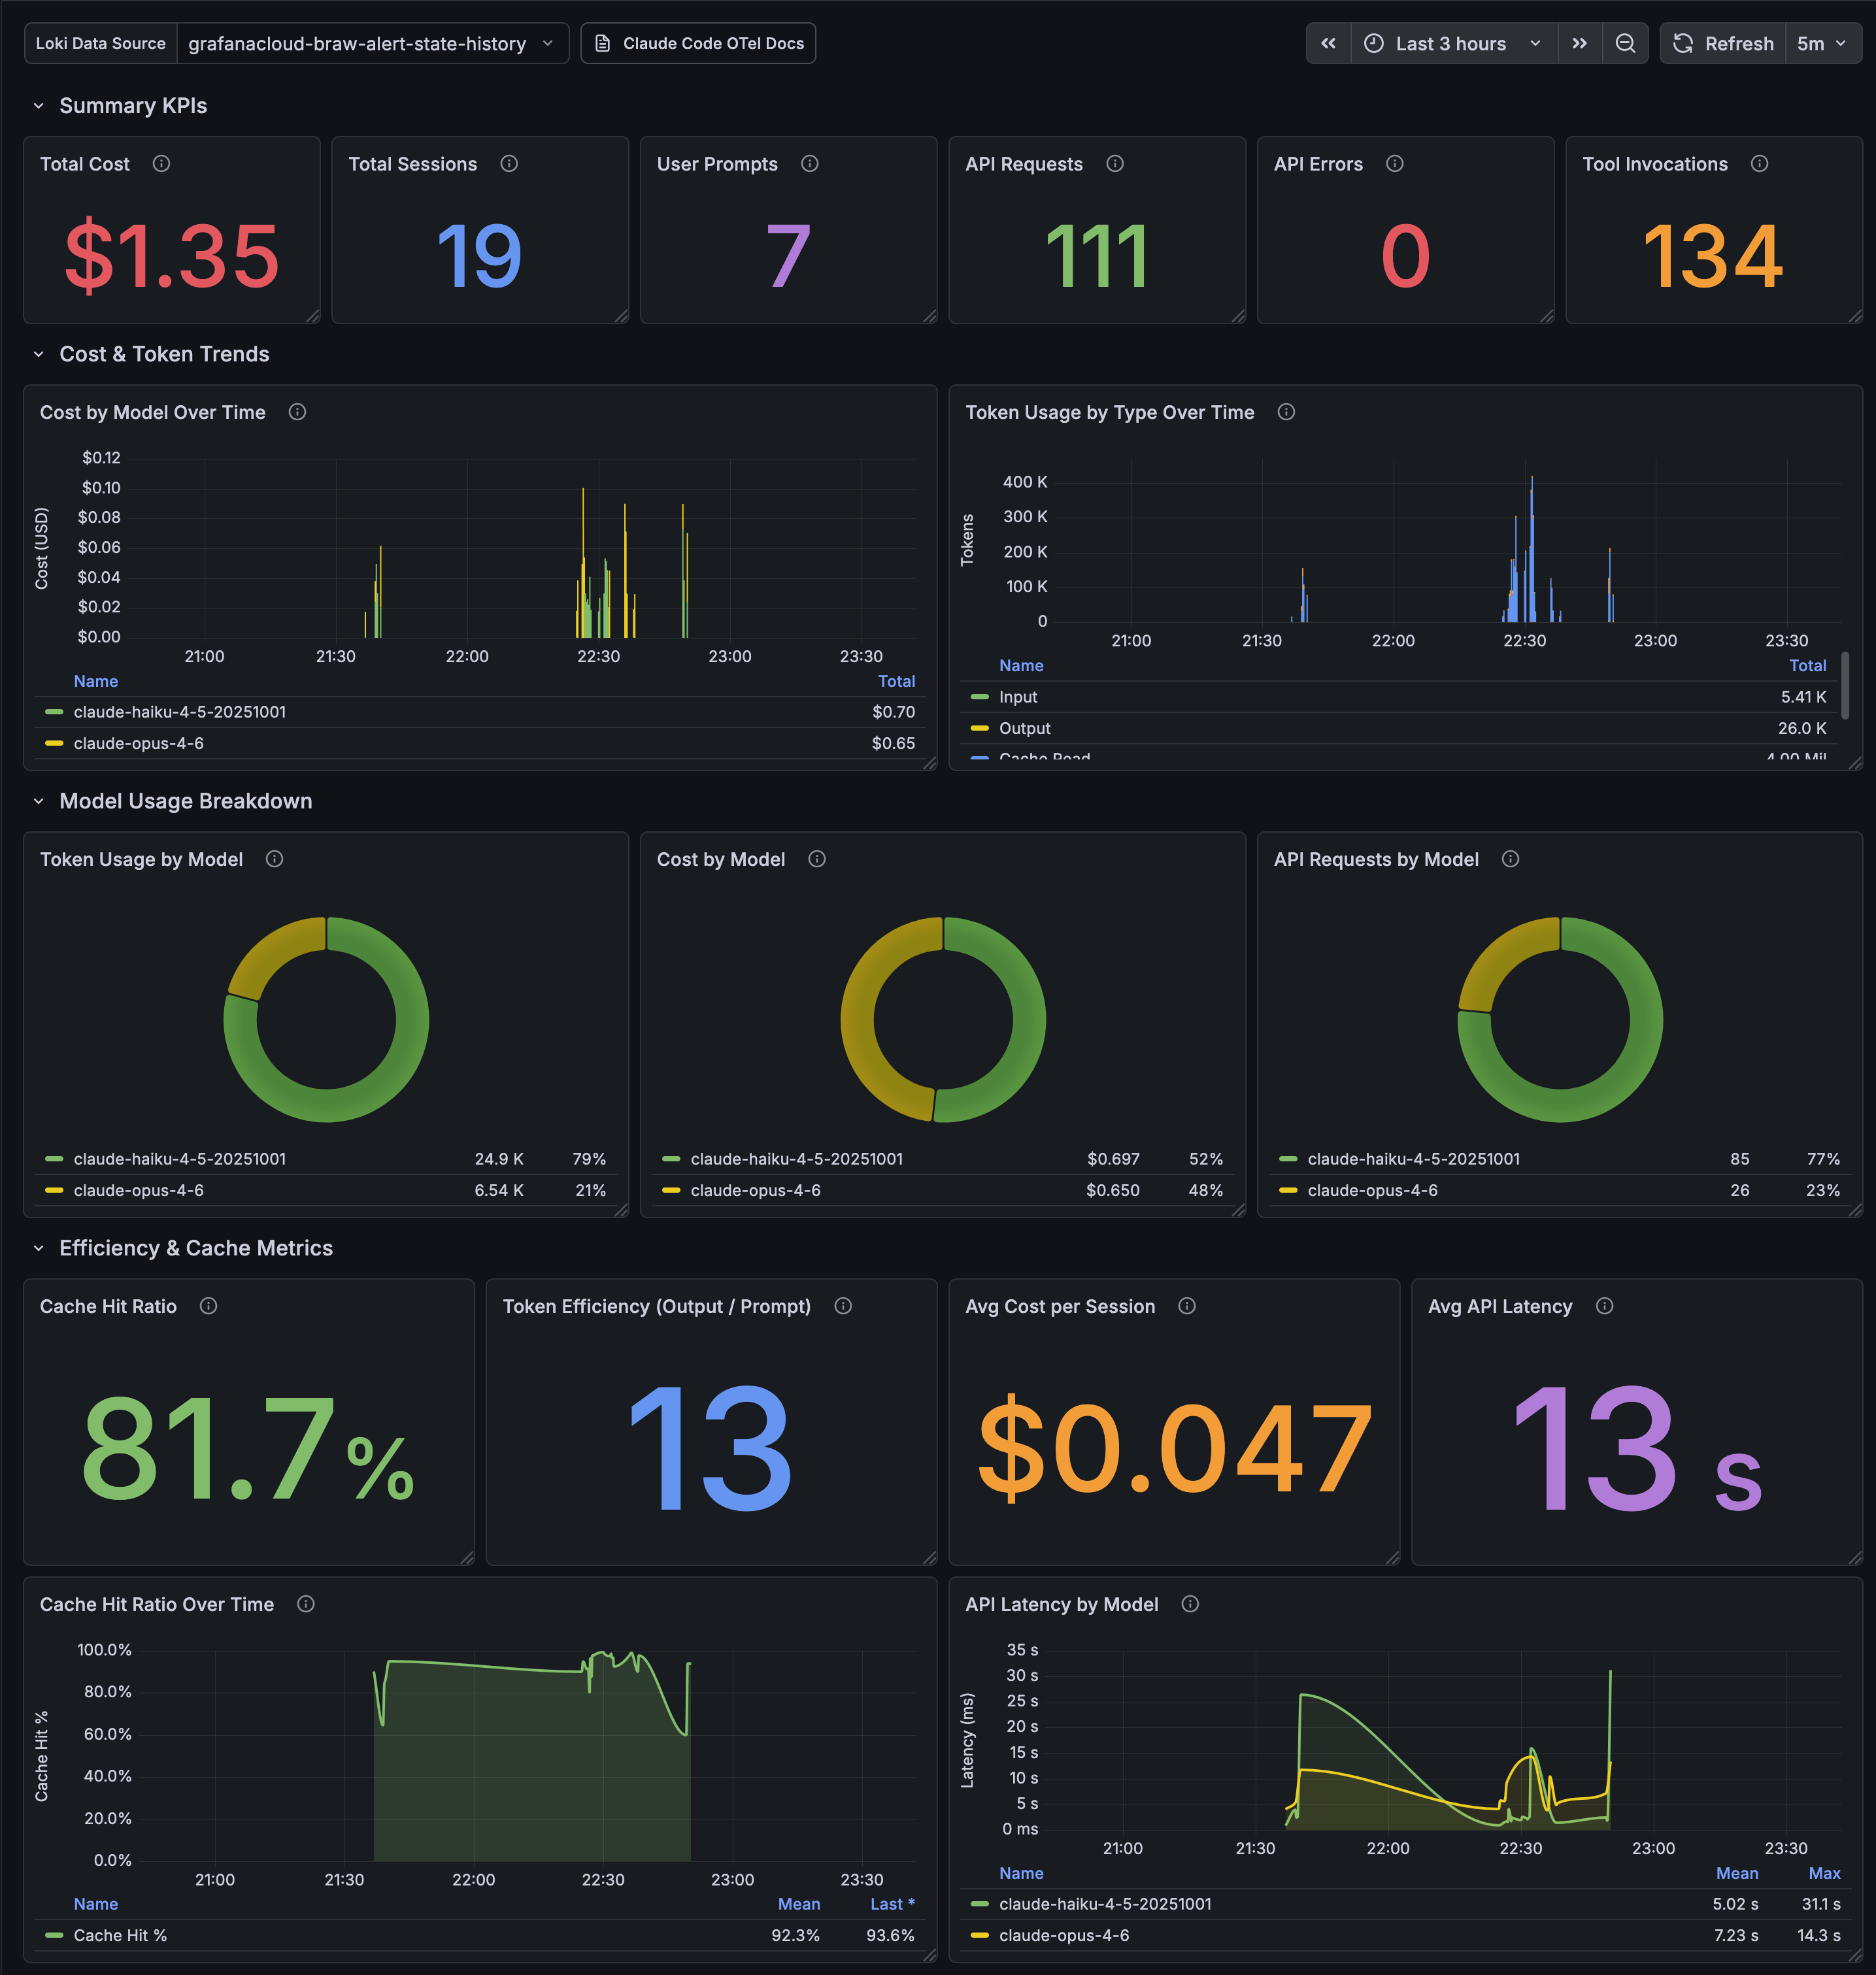
If you’re also using Grafana you can import the following JSON to get the same dashboard.
Testing out user claims
I’ve seen some claims on Twitter (currently known as “X”) and LinkedIn that simply saying “hello” was enough to burn significant Claude usage, but lets see how true that is.
Start a new Claude session and send “hello”:
claude hello

⏺ Hello! How can I help you today?
Find the most recent session ID in our Find the most recent session ID in our https://grafana.com/explore
page and selecting our logs datasource from the dropdown in the top-left.
{service_name="claude-code"} | session_id != "" | line_format "{{.session_id}}"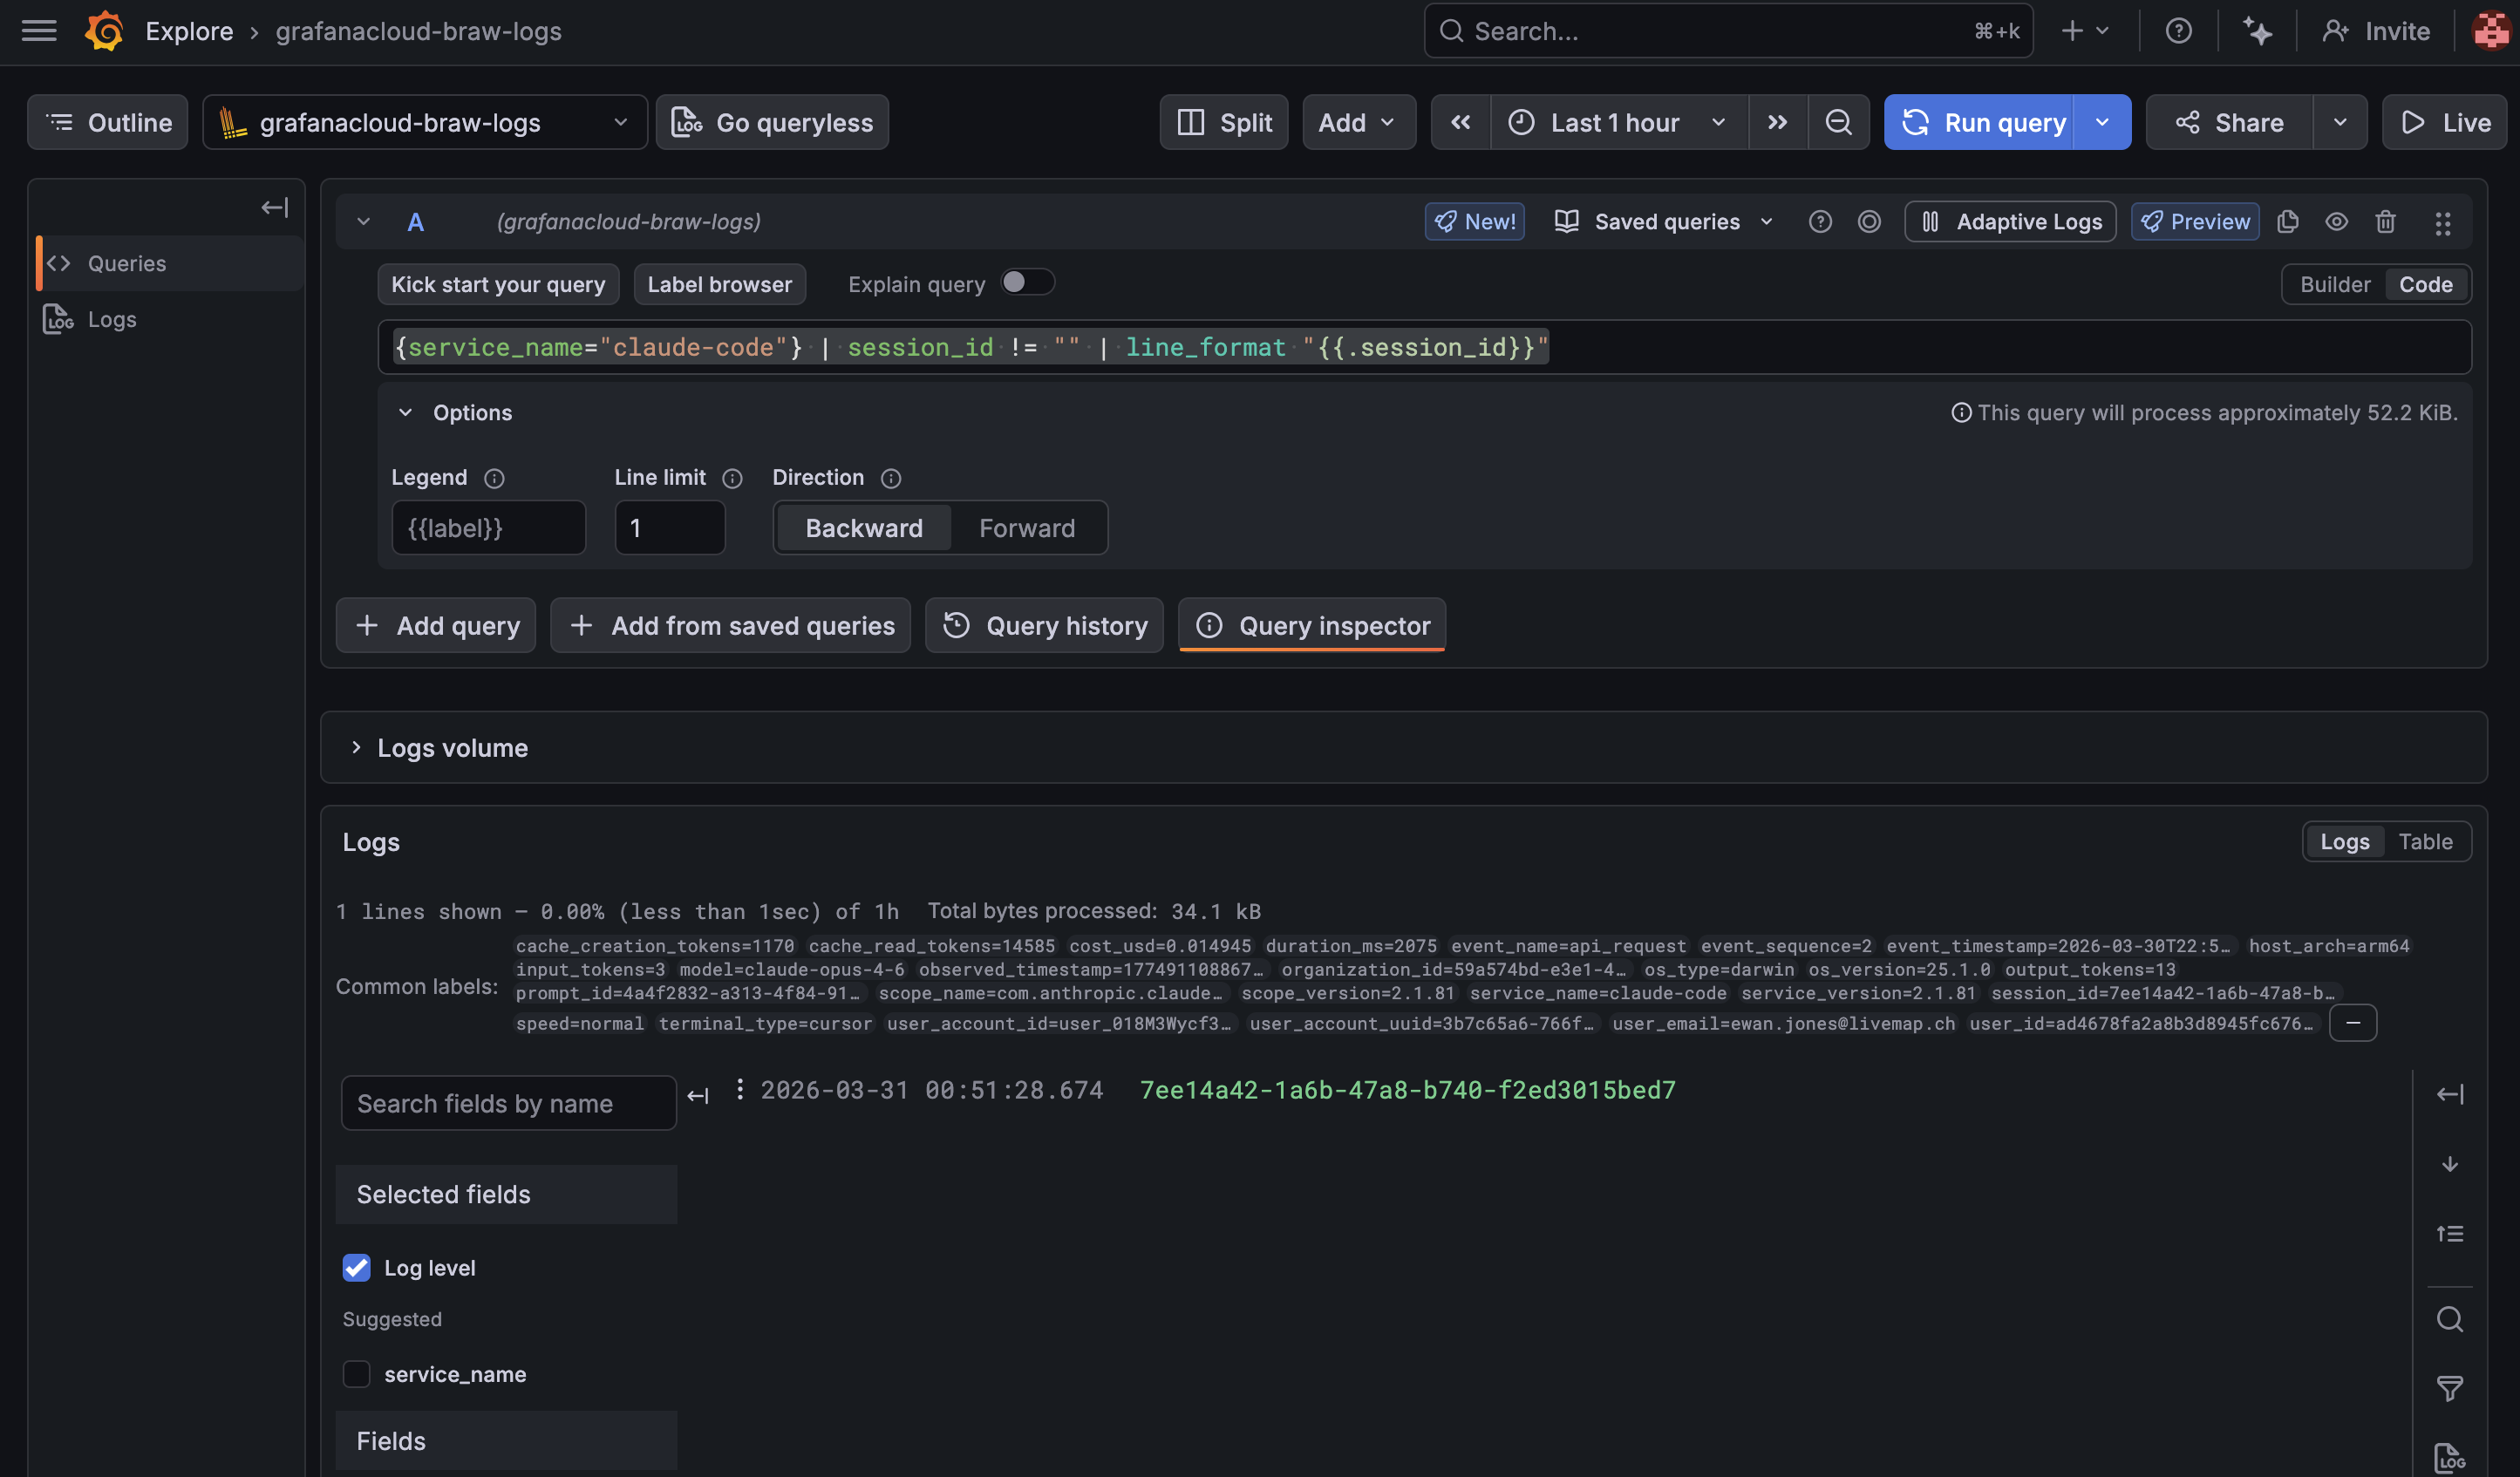
By adding a limit of 1 and selecting Direction: Backward we can see the most recent session ID.
And then we can use that session ID (replace session_id in the examples below) to query things
like the total cost in USD:
sum(sum_over_time({service_name="claude-code"} | session_id="{{ session_id }}" | unwrap cost_usd [$__auto]))

0.0153
or the total input_tokens:
sum(sum_over_time({service_name="claude-code"} | session_id="{{ session_id }}" | unwrap input_tokens [$__auto]))

340
or the total cache_read_tokens (seems oddly high for a new session):
sum(sum_over_time({service_name="claude-code"} | session_id="{{ session_id }}" | unwrap cache_read_tokens [$__auto]))

14,585
Maybe higher than we were expecting but definitely shouldn’t be using all significant chunks of your usage…
At least now you can leave this running and monitor usage over time. If you’re hitting limits dive back in and see how much your recent sessions really consumed.
This was a fun experiment which involved getting to know OpenTelemetry a bit better, a bit of peaking inside Claude Code and observing my token usage.